" If we move from a natural climate to an artificially controlled climate we will move from a globe where random changes might kill millions or billions to one where everyone might be killed"
Climate models
There has been a warming of about 0.8 degrees centigrade in average global temperatures over the past century. Warmings and coolings of this amount are not particularly unusual over the history of the earth and are common in the past 400,000 years. Is there any reason to be concerned about the recent warming? The answer to this question depends upon scientific, predictive models of the climate. Most climate models predict that there is indeed cause for concern and that the recent 0.8 degrees centigrade is just the beginning of a possibly dangerous swing in temperature. It is interesting to examine these models to see whether the predictions are credible.
The basic idea of global heat exchange
All of the heat that drives the climate is received from the sun. In the long term the amount of heat supplied by the sun will exactly equal the amount of heat emitted by the earth and the temperature of the surface of the earth will depend on both the total radiation absorbed and on the partition of the solar heating between the various parts of the atmosphere, sea and land surface. It is in this partitioning of thermal energy that the analysis becomes complicated.
Global warming is about the temperature of the air near the ground. The lowest layer of the atmosphere is called the "troposphere" and the global warming of 0.8 degrees Celsius a century has occurred in this layer. The troposphere is just like a greenhouse which is why the warming is usually blamed on the "greenhouse effect". The big question is whether the rise in temperature within the troposphere greenhouse is due to making it an even more effective greenhouse by adding carbon dioxide or is it due to simply shining more light on its roof.
The thermal budget for the earth is summarised in the following picture:

Notice that a lot of heat (LW_UP and LW_DOWN) is reflected back and forth between the atmosphere and the land, like in a greenhouse, before heating the atmosphere sufficiently for it to lose heat to space. It may surprise many readers but most of the heat that is returned by the earth to space is emitted as heat radiation by the intermediate layers of the atmosphere - just look at the diagram above. These layers are like the glass in a greenhouse, they must be made sufficiently hot to radiate an amount of heat equal to the energy of all the heat and light from the sun that is not directly reflected from the earth's surface.
The effect of sunshine
Before further considering the complex partitioning of heat in the atmosphere the first point to establish is that there has not been a simple increase in the amount of energy received from the sun over the past century.
The total solar irradiance (the radiation striking the earth per square metre) has been measured using satellites and is summarised in the following graphs:

(From "Solar Constant, Construction of a Composite Total Solar Irradiance (TSI) Time Series from 1978 to present. Frohlich 2006 Davos World Radiation Center)
The satellite missions have shown that there is very little change in solar irradiance since 1976:

At most a one part in one thousand change. (see Frohlich (2006)).
It is interesting how the heat striking the earth varies with sunspot activity:

As well as irradiance, the sea surface temperature is also weakly correlated with sunspot activity.

This is not surprising because the sun is most active when there are most sunspots.
This sunspot activity marks the presence of an increased solar wind that screens the earth from cosmic rays and hence results in a decreased concentration of carbon-14 in the atmosphere:

There is approximately a 60 year delay between sunspot levels and radiocarbon changes. Courtesy Wikipedia.
Sunspot activity and the inverse of carbon-14 concentrations can therefore be used as "proxies" for solar activity. However, this "proxy" effect is very crude and only suitable for guessing at large scale changes in irradiance. For example, the coarseness of sunspot activity as a predictor of irradiance is evident from the way that sunspot activity has fallen considerably in recent years even though irradiance has scarcely changed.
It is certain that solar activity warms the earth and there is evidence that changes in solar activity are correlated with temperature changes on earth. The big question is whether or not solar activity is the sole or even the major driver of global climate change. Just examining correlations between sunspots and temperature will not answer this question. We need quantitative data.
Other predictors that will be considered below have been more closely linked to climate change:

Courtesy Wikipedia
According to the formula of 0.6-1.6 degrees centigrade in global temperature per percent change in irradiance (Hansen et al (1997), Hansen et al (1981)) a 0.7% increase in irradiance per century would change global temperatures by about 0.8 degrees centigrade and account for the amount of warming measured. The only difficulty with this estimate is that the 0.7% change in irradiance did not occur and there was probably no change in irradiance.
If changes in irradiance were the cause of recent warming there would be little to concern us, the present global warming would just be a transient spike of solar activity. However, the data is not strong enough to show that increased irradiance is the cause of warming and there are good grounds for believing that other factors are involved.
The Greenhouse Effect
The greenhouse effect is very similar to the heating of an ordinary greenhouse. In a greenhouse the visible light passes through the glass and strikes the ground where it is absorbed. The ground heats up and transfers heat to the air in the greenhouse. The air and ground within the greenhouse emit heat radiation (infrared radiation) but the glass does not let this through, the glass reflects the heat back to the ground. The greenhouse continues to get hotter until the glass itself is hot enough to restore the energy balance by radiating heat (and transferring heat) to the atmosphere outside.
Some gases act a bit like glass. They allow short wavelengths of radiation such as visible light to pass through freely but not infrared (thermal) radiation. The net effect of this is that the parts of the atmosphere that contain these gases and the ground itself will get warmer than might otherwise be the case. The greenhouse effect of gases can be demonstrated in the laboratory. If you shine an intense beam of light through a column of carbon dioxide the base of the column warms up more than if you shine a light through a column of air.
The greenhouse effect will be greatest where the atmosphere is densest so it might be suspected that greenhouse warming will affect the atmosphere nearest to the ground. This possibility could be used to discriminate between greenhouse warming and warming due to solar irradiance. To understand how such a test might be applied it is first necessary to understand how heat is distributed in the atmosphere. The atmosphere gets colder with height - the tops of tall mountains are freezing cold - but what is not generally known is that past a certain height it begins to warm up again due to direct solar heating. The point at which this change from cooling to heating occurs is known as the "tropopause". The atmosphere above the tropopause is known as the "stratosphere" and the atmosphere below the tropopause is the "troposphere". The tropopause itself is at a height of about 15km. If the gases in the troposphere are warming anomalously and expanding it might be expected that the tropopause would move upwards in the atmosphere. Santer et al (2006) explored this possibility and calculated the change in the height of the tropopause in response to warming due to greenhouse gases and to warming due to direct increases in irradiance and compared these changes with data from radiosondes (weather balloons etc).

Source: https://www.llnl.gov/str/March04/gifs/Santer2.jpg
They found that the tropopause had indeed risen as a result of greenhouse warming of the atmosphere. This rise could not be explained by changes in irradiance and other natural effects (blue line on graph). The graph has a label for "Anthropogenic" forcings, it should probably read "Greenhouse" effects.
The tropopause is also important because, being the point where the temperature changes from getting colder to getting hotter. It is the balance of energy crossing the tropopause that most affects the temperatures near the ground.
The relative effects of various gases and other phenomena on this energy budget at the tropopause is shown in the graph below:
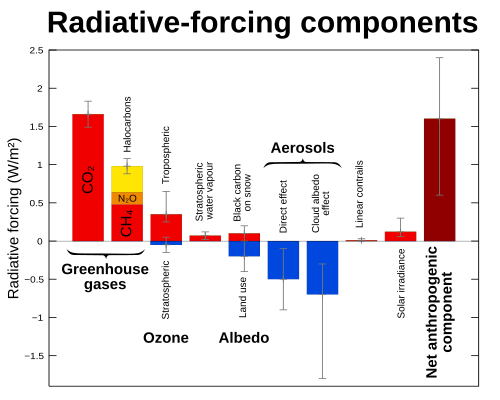
Image courtesy Wikimedia. The graph has a label for "Anthropogenic" effects, it should probably read "Greenhouse and other, possibly anthropogenic" effects.
The increase or decrease in heat balance at the tropopause is known as "Radiative Forcing".
The effects of each watt of radiative forcing and each watt of increased solar irradiance on surface temperature are approximately similar - about 0.6 to 1.6 degrees centigrade per percent change in heat balance (Hansen et al 1981,1997). A "ball park" calculation shows that the 1% change in heat balance at the tropopause due to greenhouse gases would change surface temperatures by about 0.6-1.6 degrees centigrade - roughly six times as much as the maximum temperature change that could be assigned to changes in solar irradiance. So it seems that the probable contribution due to the greenhouse effect is about six times the amount that might conceivably be due to changes in irradiance if the highest values for these irradiance changes were used.
This is a good moment to take stock: the lower atmosphere could be warmed by increased solar radiation AND by the greenhouse effect. Warming due to adding CO2 to air is a physical phenomenon and so if CO2 increases then air temperature must increase and it is also true that increases in solar radiation will warm the air. The increases in CO2 are sufficient to account for all of the warming - had there been an increase in solar radiation this warming would have been even more intense.
There is considerable circumstantial evidence for carbon dioxide being closely linked to temperature change. Data from the Vostok ice cores in the Antarctic suggests that temperature changes have been closely coupled to carbon dioxide over the past 400000 years:

If the current levels of carbon dioxide are included on this graph it can be seen that these are extraordinary high compared with historical levels:

Graph from "Cut CO2" http://www.cutco2.org/
The carbon dioxide budget
There are 750 billion metric tonnes of carbon in the atmosphere. Anthropogenic sources are currently adding about 9-10 billion tonnes per annum. If we stopped adding CO2 "About 50% of the added CO2 would be removed from the atmosphere after 50 years, and about 80% of it would be removed after 400 years" (CDIAC Data).
Emissions
About 15-20% (1.4 billion tonnes) of anthropogenic carbon dioxide emissions come from changes in land use, including the conversion of forests and grasslands to agriculture (Houghton and Hackler 2000). Although in 1998 it is calculated that up to 65% of the CO2 released came from land use (Erbrecht and Lucht1 (2006)). "The annual growth of atmospheric CO2 was 1.8 ppm in 2008, slightly below the average for the period 2000-2008 of 1.9 ppm per year (ppm = parts per million). The mean growth rate for the previous 20 years was about 1.5 ppm per year. This increase brought the atmospheric CO2 concentration to 385 ppm in 2008, 38% above the concentration at the start of the industrial revolution (about 280 ppm in 1750). The present concentration is the highest during at least the last 2 million years." (CDIAC Data).

CDIAC Data
The rest (about 8 billion tonnes) is from fossil fuel burning. "Fossil fuel CO2 emissions continued to grow strongly in 2008 at 2% per year. This growth lead to an all time high of 8.7 PgC emitted to the atmosphere (1 Pg = 1 billion tons or 1000 x million tons), 29% above emissions in 2000, and 41% above the Kyoto reference year 1990. Coal is now the largest fossil-fuel source of CO2 emissions. Over 90% of the growth in coal emissions results from increased coal use in China and India." (CDIAC Data).
Sinks
Carbon dioxide released into the atmosphere can pass into two main reservoirs, the oceans (26%), and the terrestrial biosphere (29%) (CDIAC Data). These sinks are not fully effective at removing carbon dioxide from the atmosphere and partition any emitted carbon dioxide so that about 55% goes into the reservoirs and about 45% remains in the atmosphere (Knorr 2009. This fraction (about 45%) of emitted carbon dioxide that stays in the atmosphere has been constant for a 150 years. This linear trend in the removal of CO2 shows that the carbon sinks are expanding linearly with the amount of CO2 released.

From Knorr 2009.
Knorr's data is from a variety of sources. The Scripps' Mauna Loa observatory in Hawaii has measured a steady rise in CO2:

Graph Scripps CO2 Program
Conclusion
It should be clear from all of this discussion and data that any debate about the origins of global warming is a debate about the relative contributions of anthropogenic emissions and other factors. There can be no doubt at all that adding greenhouse gases to the troposphere must cause some greenhouse warming. However, some climate sceptics would maintain that if the most extreme values for changes in solar radiation and other factors are used and the lowest figures for the effects of greenhouse gases are taken then anthropogenic warming may account for only a quarter or a half of the observed warming. Given that all of the measurements are subject to observational error you are quite entitled to take an extreme view in either direction, either believing that greenhouse gases are 100% or 25% responsible for warming, but you are unlikely to be right. The most likely analysis is that man made greenhouse gas emissions are largely responsible for global warming.
Don't panic. The temperature changes caused by man-made emissions are in the normal range for planet Earth over periods of millions of years. In fact the predicted temperature changes are quite small compared with those that have occurred in the past. All that has changed is that we have filled the Earth with so many people that large numbers might be killed by normal fluctuations. The real problem is overpopulation. Overpopulation is hugely irresponsible because it not only increases greenhouse gas emissions, depletes resources and exterminates wildlife, it also changes normal events such as a two or four degree change in surface temperature, war, viral mutations or a decade of crop failures etc. into catastrophes that might kill millions or even billions.
The most ironic aspect of the global warming debate is that global warming is only a small element in the ecological collapse predictions for the world: see The limits to growth - the end of the world as we know it? basically the global warming deniers deny anything that suggests the globe is finite.
A word of warning, be wary, very wary of those who propose that climate change can be solved by geo-engineering. Geo-engineering will reduce the complexity of the global climate and simple systems are less stable than complex systems. If we move from a natural climate to an artificially controlled climate we will move from a globe where random changes might kill millions or billions to one where everyone might be killed. Geo-engineering is wrong in principle, don't let it happen (See Blue Haze, Brown Clouds and the need to stop Geoengineering before it begins. .
See also:
The Evidence for Global Warming. (1) the Himalayas
The Evidence for Global Warming. (2) Analysis using source data for global changes
Global warming (3) man or nature?
The strange case of the missing CO2
Global Warming: What Will Change?
Is climate change a threat because of overpopulation?
Blue Haze, Brown Clouds and the need to stop Geoengineering before it begins.
Global warming: what do we do now?
References
Erbrecht, T. and Lucht1, W. (2006) Impacts of large-scale climatic disturbances on the terrestrial carbon cycle. Carbon Balance and Management 2006, 1:7doi:10.1186/1750-0680-1-7 http://www.cbmjournal.com/content/1/1/7
Hansen et al (1981). Climate impact of increasing carbon dioxide. Science, 1981, Vol 213 pp 957-66
Hansen et al (1997) Radiative forcing and climate response. Journal of Geophysical Research. 1997 102:6831-6864 http://www.junkscience.org/Greenhouse/1997_Hansen_etal_4.pdf
Houghton, R.A., and J.L. Hackler. 2000. Carbon Flux to the Atmosphere from Land-Use
Changes. In Trends: A Compendium of Data on Global Change. Carbon Dioxide Information Analysis
Center, Oak Ridge National Laboratory, U.S. Department of Energy, Oak Ridge, Tenn., U.S.A.
Knorr, W. (2009) Is the airborne fraction of anthropogenic CO2 emissions increasing? GEOPHYSICAL RESEARCH LETTERS, VOL. 36, L21710, doi:10.1029/2009GL040613, 2009
Santer et al (2003) Contributions of Anthropogenic and Natural Forcing to Recent Tropopause Height Changes. Science 25 July 2003: Vol. 301. no. 5632, pp. 479 - 483
Rigby, M., R.G. Prinn, P.J. Fraser, P.G. Simmonds, R.L. Langenfelds, J. Huang, D.M. Cunnold, L,P. Steele, P.B. Krummel, R.F. Weiss, S. O'Doherty, P.K. Salameh, H.J. Wang, C.M. Harth, J. Mühle and L.W. Porter (2008) Renewed growth of atmospheric methane. Geophysical Research Letters 35: L22805.
http://globalchange.mit.edu/pubs/abstract.php?publication_id=1968
First published 2/2/2010
Climate models
There has been a warming of about 0.8 degrees centigrade in average global temperatures over the past century. Warmings and coolings of this amount are not particularly unusual over the history of the earth and are common in the past 400,000 years. Is there any reason to be concerned about the recent warming? The answer to this question depends upon scientific, predictive models of the climate. Most climate models predict that there is indeed cause for concern and that the recent 0.8 degrees centigrade is just the beginning of a possibly dangerous swing in temperature. It is interesting to examine these models to see whether the predictions are credible.
The basic idea of global heat exchange
All of the heat that drives the climate is received from the sun. In the long term the amount of heat supplied by the sun will exactly equal the amount of heat emitted by the earth and the temperature of the surface of the earth will depend on both the total radiation absorbed and on the partition of the solar heating between the various parts of the atmosphere, sea and land surface. It is in this partitioning of thermal energy that the analysis becomes complicated.
Global warming is about the temperature of the air near the ground. The lowest layer of the atmosphere is called the "troposphere" and the global warming of 0.8 degrees Celsius a century has occurred in this layer. The troposphere is just like a greenhouse which is why the warming is usually blamed on the "greenhouse effect". The big question is whether the rise in temperature within the troposphere greenhouse is due to making it an even more effective greenhouse by adding carbon dioxide or is it due to simply shining more light on its roof.
The thermal budget for the earth is summarised in the following picture:

Notice that a lot of heat (LW_UP and LW_DOWN) is reflected back and forth between the atmosphere and the land, like in a greenhouse, before heating the atmosphere sufficiently for it to lose heat to space. It may surprise many readers but most of the heat that is returned by the earth to space is emitted as heat radiation by the intermediate layers of the atmosphere - just look at the diagram above. These layers are like the glass in a greenhouse, they must be made sufficiently hot to radiate an amount of heat equal to the energy of all the heat and light from the sun that is not directly reflected from the earth's surface.
The effect of sunshine
Before further considering the complex partitioning of heat in the atmosphere the first point to establish is that there has not been a simple increase in the amount of energy received from the sun over the past century.
The total solar irradiance (the radiation striking the earth per square metre) has been measured using satellites and is summarised in the following graphs:
(From "Solar Constant, Construction of a Composite Total Solar Irradiance (TSI) Time Series from 1978 to present. Frohlich 2006 Davos World Radiation Center)
The satellite missions have shown that there is very little change in solar irradiance since 1976:

At most a one part in one thousand change. (see Frohlich (2006)).
It is interesting how the heat striking the earth varies with sunspot activity:

As well as irradiance, the sea surface temperature is also weakly correlated with sunspot activity.

This is not surprising because the sun is most active when there are most sunspots.
This sunspot activity marks the presence of an increased solar wind that screens the earth from cosmic rays and hence results in a decreased concentration of carbon-14 in the atmosphere:

There is approximately a 60 year delay between sunspot levels and radiocarbon changes. Courtesy Wikipedia.
Sunspot activity and the inverse of carbon-14 concentrations can therefore be used as "proxies" for solar activity. However, this "proxy" effect is very crude and only suitable for guessing at large scale changes in irradiance. For example, the coarseness of sunspot activity as a predictor of irradiance is evident from the way that sunspot activity has fallen considerably in recent years even though irradiance has scarcely changed.
It is certain that solar activity warms the earth and there is evidence that changes in solar activity are correlated with temperature changes on earth. The big question is whether or not solar activity is the sole or even the major driver of global climate change. Just examining correlations between sunspots and temperature will not answer this question. We need quantitative data.
Other predictors that will be considered below have been more closely linked to climate change:
Courtesy Wikipedia
According to the formula of 0.6-1.6 degrees centigrade in global temperature per percent change in irradiance (Hansen et al (1997), Hansen et al (1981)) a 0.7% increase in irradiance per century would change global temperatures by about 0.8 degrees centigrade and account for the amount of warming measured. The only difficulty with this estimate is that the 0.7% change in irradiance did not occur and there was probably no change in irradiance.
If changes in irradiance were the cause of recent warming there would be little to concern us, the present global warming would just be a transient spike of solar activity. However, the data is not strong enough to show that increased irradiance is the cause of warming and there are good grounds for believing that other factors are involved.
The Greenhouse Effect
The greenhouse effect is very similar to the heating of an ordinary greenhouse. In a greenhouse the visible light passes through the glass and strikes the ground where it is absorbed. The ground heats up and transfers heat to the air in the greenhouse. The air and ground within the greenhouse emit heat radiation (infrared radiation) but the glass does not let this through, the glass reflects the heat back to the ground. The greenhouse continues to get hotter until the glass itself is hot enough to restore the energy balance by radiating heat (and transferring heat) to the atmosphere outside.
Some gases act a bit like glass. They allow short wavelengths of radiation such as visible light to pass through freely but not infrared (thermal) radiation. The net effect of this is that the parts of the atmosphere that contain these gases and the ground itself will get warmer than might otherwise be the case. The greenhouse effect of gases can be demonstrated in the laboratory. If you shine an intense beam of light through a column of carbon dioxide the base of the column warms up more than if you shine a light through a column of air.
The greenhouse effect will be greatest where the atmosphere is densest so it might be suspected that greenhouse warming will affect the atmosphere nearest to the ground. This possibility could be used to discriminate between greenhouse warming and warming due to solar irradiance. To understand how such a test might be applied it is first necessary to understand how heat is distributed in the atmosphere. The atmosphere gets colder with height - the tops of tall mountains are freezing cold - but what is not generally known is that past a certain height it begins to warm up again due to direct solar heating. The point at which this change from cooling to heating occurs is known as the "tropopause". The atmosphere above the tropopause is known as the "stratosphere" and the atmosphere below the tropopause is the "troposphere". The tropopause itself is at a height of about 15km. If the gases in the troposphere are warming anomalously and expanding it might be expected that the tropopause would move upwards in the atmosphere. Santer et al (2006) explored this possibility and calculated the change in the height of the tropopause in response to warming due to greenhouse gases and to warming due to direct increases in irradiance and compared these changes with data from radiosondes (weather balloons etc).

Source: https://www.llnl.gov/str/March04/gifs/Santer2.jpg
They found that the tropopause had indeed risen as a result of greenhouse warming of the atmosphere. This rise could not be explained by changes in irradiance and other natural effects (blue line on graph). The graph has a label for "Anthropogenic" forcings, it should probably read "Greenhouse" effects.
The tropopause is also important because, being the point where the temperature changes from getting colder to getting hotter. It is the balance of energy crossing the tropopause that most affects the temperatures near the ground.
The relative effects of various gases and other phenomena on this energy budget at the tropopause is shown in the graph below:
Image courtesy Wikimedia. The graph has a label for "Anthropogenic" effects, it should probably read "Greenhouse and other, possibly anthropogenic" effects.
The increase or decrease in heat balance at the tropopause is known as "Radiative Forcing".
The effects of each watt of radiative forcing and each watt of increased solar irradiance on surface temperature are approximately similar - about 0.6 to 1.6 degrees centigrade per percent change in heat balance (Hansen et al 1981,1997). A "ball park" calculation shows that the 1% change in heat balance at the tropopause due to greenhouse gases would change surface temperatures by about 0.6-1.6 degrees centigrade - roughly six times as much as the maximum temperature change that could be assigned to changes in solar irradiance. So it seems that the probable contribution due to the greenhouse effect is about six times the amount that might conceivably be due to changes in irradiance if the highest values for these irradiance changes were used.
This is a good moment to take stock: the lower atmosphere could be warmed by increased solar radiation AND by the greenhouse effect. Warming due to adding CO2 to air is a physical phenomenon and so if CO2 increases then air temperature must increase and it is also true that increases in solar radiation will warm the air. The increases in CO2 are sufficient to account for all of the warming - had there been an increase in solar radiation this warming would have been even more intense.
There is considerable circumstantial evidence for carbon dioxide being closely linked to temperature change. Data from the Vostok ice cores in the Antarctic suggests that temperature changes have been closely coupled to carbon dioxide over the past 400000 years:
If the current levels of carbon dioxide are included on this graph it can be seen that these are extraordinary high compared with historical levels:

Graph from "Cut CO2" http://www.cutco2.org/
The carbon dioxide budget
There are 750 billion metric tonnes of carbon in the atmosphere. Anthropogenic sources are currently adding about 9-10 billion tonnes per annum. If we stopped adding CO2 "About 50% of the added CO2 would be removed from the atmosphere after 50 years, and about 80% of it would be removed after 400 years" (CDIAC Data).
Emissions
About 15-20% (1.4 billion tonnes) of anthropogenic carbon dioxide emissions come from changes in land use, including the conversion of forests and grasslands to agriculture (Houghton and Hackler 2000). Although in 1998 it is calculated that up to 65% of the CO2 released came from land use (Erbrecht and Lucht1 (2006)). "The annual growth of atmospheric CO2 was 1.8 ppm in 2008, slightly below the average for the period 2000-2008 of 1.9 ppm per year (ppm = parts per million). The mean growth rate for the previous 20 years was about 1.5 ppm per year. This increase brought the atmospheric CO2 concentration to 385 ppm in 2008, 38% above the concentration at the start of the industrial revolution (about 280 ppm in 1750). The present concentration is the highest during at least the last 2 million years." (CDIAC Data).

CDIAC Data
The rest (about 8 billion tonnes) is from fossil fuel burning. "Fossil fuel CO2 emissions continued to grow strongly in 2008 at 2% per year. This growth lead to an all time high of 8.7 PgC emitted to the atmosphere (1 Pg = 1 billion tons or 1000 x million tons), 29% above emissions in 2000, and 41% above the Kyoto reference year 1990. Coal is now the largest fossil-fuel source of CO2 emissions. Over 90% of the growth in coal emissions results from increased coal use in China and India." (CDIAC Data).
Sinks
Carbon dioxide released into the atmosphere can pass into two main reservoirs, the oceans (26%), and the terrestrial biosphere (29%) (CDIAC Data). These sinks are not fully effective at removing carbon dioxide from the atmosphere and partition any emitted carbon dioxide so that about 55% goes into the reservoirs and about 45% remains in the atmosphere (Knorr 2009. This fraction (about 45%) of emitted carbon dioxide that stays in the atmosphere has been constant for a 150 years. This linear trend in the removal of CO2 shows that the carbon sinks are expanding linearly with the amount of CO2 released.

From Knorr 2009.
Knorr's data is from a variety of sources. The Scripps' Mauna Loa observatory in Hawaii has measured a steady rise in CO2:

Graph Scripps CO2 Program
Conclusion
It should be clear from all of this discussion and data that any debate about the origins of global warming is a debate about the relative contributions of anthropogenic emissions and other factors. There can be no doubt at all that adding greenhouse gases to the troposphere must cause some greenhouse warming. However, some climate sceptics would maintain that if the most extreme values for changes in solar radiation and other factors are used and the lowest figures for the effects of greenhouse gases are taken then anthropogenic warming may account for only a quarter or a half of the observed warming. Given that all of the measurements are subject to observational error you are quite entitled to take an extreme view in either direction, either believing that greenhouse gases are 100% or 25% responsible for warming, but you are unlikely to be right. The most likely analysis is that man made greenhouse gas emissions are largely responsible for global warming.
Don't panic. The temperature changes caused by man-made emissions are in the normal range for planet Earth over periods of millions of years. In fact the predicted temperature changes are quite small compared with those that have occurred in the past. All that has changed is that we have filled the Earth with so many people that large numbers might be killed by normal fluctuations. The real problem is overpopulation. Overpopulation is hugely irresponsible because it not only increases greenhouse gas emissions, depletes resources and exterminates wildlife, it also changes normal events such as a two or four degree change in surface temperature, war, viral mutations or a decade of crop failures etc. into catastrophes that might kill millions or even billions.
The most ironic aspect of the global warming debate is that global warming is only a small element in the ecological collapse predictions for the world: see The limits to growth - the end of the world as we know it? basically the global warming deniers deny anything that suggests the globe is finite.
A word of warning, be wary, very wary of those who propose that climate change can be solved by geo-engineering. Geo-engineering will reduce the complexity of the global climate and simple systems are less stable than complex systems. If we move from a natural climate to an artificially controlled climate we will move from a globe where random changes might kill millions or billions to one where everyone might be killed. Geo-engineering is wrong in principle, don't let it happen (See Blue Haze, Brown Clouds and the need to stop Geoengineering before it begins. .
See also:
The Evidence for Global Warming. (1) the Himalayas
The Evidence for Global Warming. (2) Analysis using source data for global changes
Global warming (3) man or nature?
The strange case of the missing CO2
Global Warming: What Will Change?
Is climate change a threat because of overpopulation?
Blue Haze, Brown Clouds and the need to stop Geoengineering before it begins.
Global warming: what do we do now?
References
Erbrecht, T. and Lucht1, W. (2006) Impacts of large-scale climatic disturbances on the terrestrial carbon cycle. Carbon Balance and Management 2006, 1:7doi:10.1186/1750-0680-1-7 http://www.cbmjournal.com/content/1/1/7
Hansen et al (1981). Climate impact of increasing carbon dioxide. Science, 1981, Vol 213 pp 957-66
Hansen et al (1997) Radiative forcing and climate response. Journal of Geophysical Research. 1997 102:6831-6864 http://www.junkscience.org/Greenhouse/1997_Hansen_etal_4.pdf
Houghton, R.A., and J.L. Hackler. 2000. Carbon Flux to the Atmosphere from Land-Use
Changes. In Trends: A Compendium of Data on Global Change. Carbon Dioxide Information Analysis
Center, Oak Ridge National Laboratory, U.S. Department of Energy, Oak Ridge, Tenn., U.S.A.
Knorr, W. (2009) Is the airborne fraction of anthropogenic CO2 emissions increasing? GEOPHYSICAL RESEARCH LETTERS, VOL. 36, L21710, doi:10.1029/2009GL040613, 2009
Santer et al (2003) Contributions of Anthropogenic and Natural Forcing to Recent Tropopause Height Changes. Science 25 July 2003: Vol. 301. no. 5632, pp. 479 - 483
Rigby, M., R.G. Prinn, P.J. Fraser, P.G. Simmonds, R.L. Langenfelds, J. Huang, D.M. Cunnold, L,P. Steele, P.B. Krummel, R.F. Weiss, S. O'Doherty, P.K. Salameh, H.J. Wang, C.M. Harth, J. Mühle and L.W. Porter (2008) Renewed growth of atmospheric methane. Geophysical Research Letters 35: L22805.
http://globalchange.mit.edu/pubs/abstract.php?publication_id=1968
First published 2/2/2010
Comments